2021 |
||||
| 22. |  | Nazemi, Kawa; Burkhardt, Dirk; Kock, Alexander Visual analytics for technology and innovation management: An interaction approach for strategic decisionmaking Journal Article In: Multimedia Tools and Applications, vol. 1198, 2021, ISSN: 1380-7501. Abstract | Links | BibTeX | Dimensions | PlumX | Tags: Emerging Trend Identification, Information Visualization, Innovation Management, Interaction Design, Multimedia Interaction, Technology Management, Visual Analytics, Visual Trend Analytics @article{Nazemi2021b,The awareness of emerging trends is essential for strategic decision making because technological trends can affect a firm’s competitiveness and market position. The rise of artificial intelligence methods allows gathering new insights and may support these decision-making processes. However, it is essential to keep the human in the loop of these complex analytical tasks, which, often lack an appropriate interaction design. Including special interactive designs for technology and innovation management is therefore essential for successfully analyzing emerging trends and using this information for strategic decision making. A combination of information visualization, trend mining and interaction design can support human users to explore, detect, and identify such trends. This paper enhances and extends a previously published first approach for integrating, enriching, mining, analyzing, identifying, and visualizing emerging trends for technology and innovation management. We introduce a novel interaction design by investigating the main ideas from technology and innovation management and enable a more appropriate interaction approach for technology foresight and innovation detection. | ||
2019 |
||||
| 21. |  | Nazemi, Kawa; Burkhardt, Dirk A Visual Analytics Approach for Analyzing Technological Trends in Technology and Innovation Management Proceedings Article In: Bebis, George; Boyle, Richard; Parvin, Bahram; Koracin, Darko; Ushizima, Daniela; Chai, Sek; Sueda, Shinjiro; Lin, Xin; Lu, Aidong; Thalmann, Daniel; Wang, Chaoli; Xu, Panpan (Ed.): Advances in Visual Computing, pp. 283–294, Springer International Publishing, Cham, 2019, ISBN: 978-3-030-33723-0. Abstract | Links | BibTeX | Dimensions | PlumX | Tags: Artificial Intelligence, Data Analytics, Human Factors, Human-Centered Interfaces, Human-Computer Interaction, Information Visualization, Intelligent Systems, maschine learning, Visual Analytics @inproceedings{Nazemi2019c,Visual Analytics provides with a combination of automated techniques and interactive visualizations huge analysis possibilities in technology and innovation management. Thereby not only the use of machine learning data mining methods plays an important role. Due to the high interaction capabilities, it provides a more user-centered approach, where users are able to manipulate the entire analysis process and get the most valuable information. Existing Visual Analytics systems for Trend Analytics and technology and innovation management do not really make use of this unique feature and almost neglect the human in the analysis process. Outcomes from research in information search, information visualization and technology management can lead to more sophisticated Visual Analytics systems that involved the human in the entire analysis process. We propose in this paper a new interaction approach for Visual Analytics in technology and innovation management with a special focus on technological trend analytics. | ||
| 20. |  | Burkhardt, Dirk; Nazemi, Kawa; Kuijper, Arjan; Ginters, Egils A Mobile Visual Analytics Approach for Instant Trend Analysis in Mobile Contexts Proceedings Article In: 5th International Conference of the Virtual and Augmented Reality in Education (VARE2019), pp. 11–19, CAL-TEK SRL, Rende, Italy, 2019, ISBN: 978-88-85741-41-6, (Nominated for Best Paper Award). Abstract | Links | BibTeX | Dimensions | PlumX | Tags: Business Analytics, Decision Support Systems, Human-Computer Interaction, Information Visualization, Mobile Devices, Mobile Visual Analytics, Visual Trend Analysis @inproceedings{Burkhardt2019b,The awareness of market trends becomes relevant for a broad number of market branches, in particular the more they are challenged by the digitalization. Trend analysis solutions help business executives identifying upcoming trends early. But solid market analysis takes their time and are often not available on consulting or strategy discussions. This circumstance often leads to unproductive debates where no clear strategy, technology etc. could be identified. Therefore, we propose a mobile visual trend analysis approach that enables a quick trend analysis to identify at least the most relevant and irrelevant aspects to focus debates on the relevant options. To enable an analysis like this, the exhausting analysis on powerful workstations with large screens has to adopted to mobile devices within a mobile behavior. Our main contribution is the therefore a new approach of a mobile knowledge cockpit, which provides different analytical visualizations within and intuitive interaction design. | ||
| 19. | 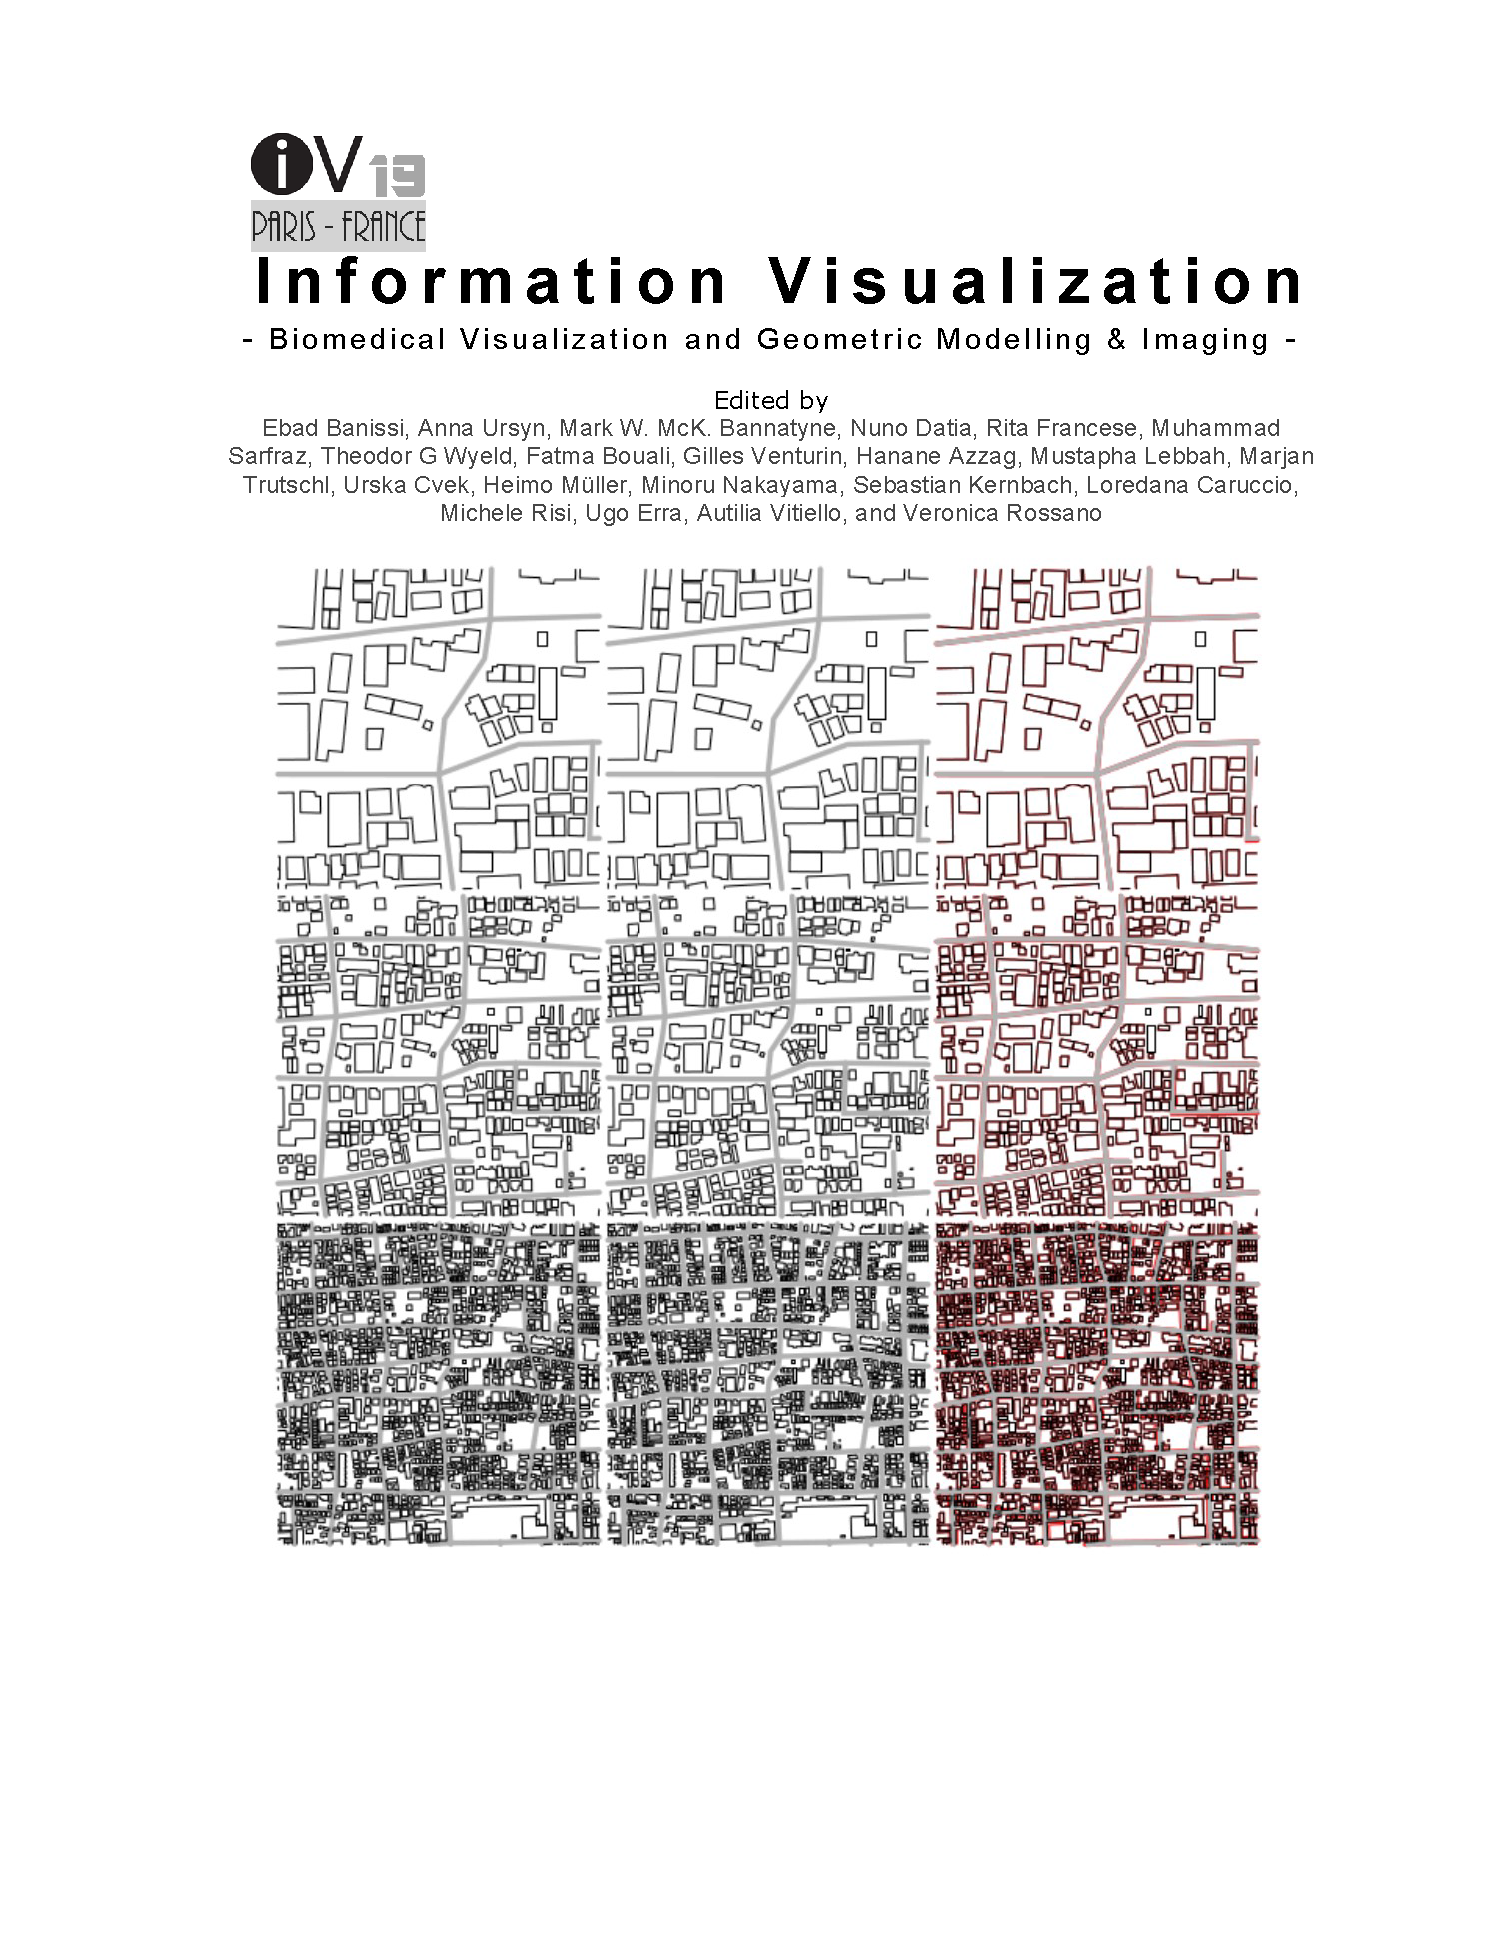 | Nazemi, Kawa; Burkhardt, Dirk Visual Analytics for Analyzing Technological Trends from Text Proceedings Article In: 2019 23rd International Conference Information Visualisation (iV), pp. 191-200, IEEE, 2019, ISSN: 2375-0138, (Best Paper Award). Abstract | Links | BibTeX | Dimensions | PlumX | Tags: Emerging Trend Identification, Information Visualization, iV, Trend Analytics, Visual Analytics, Visual Business Analytics @inproceedings{Nazemi2018b,The awareness of emerging technologies is essential for strategic decision making in enterprises. Emerging and decreasing technological trends could lead to strengthening the competitiveness and market positioning. The exploration, detection and identification of such trends can be essentially supported through information visualization, trend mining and in particular through the combination of those. Commonly, trends appear first in science and scientific documents. However, those documents do not provide sufficient information for analyzing and identifying emerging trends. It is necessary to enrich data, extract information from the integrated data, measure the gradient of trends over time and provide effective interactive visualizations. We introduce in this paper an approach for integrating, enriching, mining, analyzing, identifying and visualizing emerging trends from scientific documents. Our approach enhances the state of the art in visual trend analytics by investigating the entire analysis process and providing an approach for enabling human to explore undetected potentially emerging trends. | ||
| 18. |  | Nazemi, Kawa; Burkhardt, Dirk Visual analytical dashboards for comparative analytical tasks – a case study on mobility and transportation Journal Article In: ICTE in Transportation and Logistics 2018 (ICTE 2018), vol. 149, pp. 138-150, 2019, ISSN: 1877-0509. Abstract | Links | BibTeX | Dimensions | PlumX | Tags: Data Analytics, Information Visualization, Mobility, Prediction, Transportation, Visual Analytics, Visual Interfaces, Visual Tasks @article{Nazemi2019,Mobility, logistics and transportation are emerging fields of research and application. Humans’ mobility behavior plays an increasing role for societal challenges. Beside the societal challenges these areas are strongly related to technologies and innovations. Gathering information about emerging technologies plays an increasing role for the entire research in these areas. Humans’ information processing can be strongly supported by Visual Analytics that combines automatic modelling and interactive visualizations. The juxtapose orchestration of interactive visualization enables gathering more information in a shorter time. We propose in this paper an approach that goes beyond the established methods of dashboarding and enables visualizing different databases, data-sets and sub-sets of data with juxtaposed visual interfaces. Our approach should be seen as an expandable method. Our main contributions are an in-depth analysis of visual task models and an approach for juxtaposing visual layouts as visual dashboards to enable solving complex tasks. We illustrate our main outcome through a case study that investigates the area of mobility and illustrates how complex analytical tasks can be performed easily by combining different visual interfaces. | ||
2018 |
||||
| 17. |  | Burkhardt, Dirk; Nazemi, Kawa Visualizing Law - A Norm-Graph Visualization Approach based on Semantic Legal Data Proceedings Article In: 4th International Conference of the Virtual and Augmented Reality in Education (VARE 2018), pp. 154-162, CAL-TEK SRL, Rende, Italy, 2018, ISBN: 978-1-5108-7222-6. Abstract | Links | BibTeX | Dimensions | PlumX | Tags: Decision Support Systems, e-Government, Information Visualization, Law Visualization, Norm-graph, Policy Modeling, Semantic Data @inproceedings{Burkhardt2018a,Laws or in general legal documents regulate a wide range of our daily life and also define the borders of business models and commercial services. However, legal text and laws are almost hard to understand. From other domains it is already known that visualizations can help understanding complex aspects easier. In fact, in this paper we introduce a new approach to visualize legal texts in a Norm-graph visualization. In the developed Norm-graph visualization it is possible to show major aspects of laws and make it easier for users to understand it. The Norm-graph is based on semantic legal data, a so called Legal-Concept-Ontology. | ||
| 16. | | Nazemi, Kawa; Burkhardt, Dirk Juxtaposing Visual Layouts – An Approach for Solving Analytical and Exploratory Tasks through Arranging Visual Interfaces Proceedings Article In: 4th International Conference of the Virtual and Augmented Reality in Education (VARE 2018), pp. 144-153, CAL-TEK SRL, Rende, Italy, 2018, ISBN: 978-1-5108-7222-6. Abstract | Links | BibTeX | Dimensions | PlumX | Tags: Information Visualization, Visual Analytics, Visual Interfaces, Visual Tasks @inproceedings{Burkhardt2018,Interactive visualization and visual analytics systems enables solving a variety of tasks. Starting with simple search tasks for outliers, anomalies etc. in data to analytical comparisons, information visualizations may lead to a faster and more precise solving of tasks. There exist a variety of methods to support users in the process of task solving, e.g. superimposing, juxtaposing or partitioning complex visual structures. Commonly all these methods make use of a single data source that is visualized at the same time. We propose in this paper an approach that goes beyond the established methods and enables visualizing different databases, data-sets and sub-sets of data with juxtaposed visual interfaces. Our approach should be seen as an expandable method. Our main contributions are an in-depth analysis of visual task models and an approach for juxtaposing visual layouts as visual interfaces to enable solving complex tasks. | ||
2017 |
||||
| 15. |  | Burkhardt, Dirk; Nazemi, Kawa Informationsvisualisierung und Visual Analytics zur Unterstützung von E-Government Prozessen Proceedings Article In: Bade, Korinna; Pietsch, Matthias; Raabe, Susanne; Schütz, Lars (Ed.): Technologische Trends im Spannungsfeld von Beteiligung – Entscheidung – Planung: Fachforum DIGITALES PLANEN und GESTALTEN 2017, pp. 29–38, Shaker Verlag, Aachen, Germany, 2017, ISBN: 978-3844054392. Abstract | Links | BibTeX | Dimensions | PlumX | Tags: e-Government, e-Participation, Information Visualization, Interactive Visualization, Policy Modeling, Visual Analytics @inproceedings{Burkhardt2017b,Politische und gesellschaftliche Prozesse werden durch Informationen sehr stark geprägt, wie auch die jüngsten Ereignisse aufzeigen. Diese Informationen können, trotz enormer Fortschritte, nicht immer aus den sehr großen, heterogenen und verteilten Daten entnommen werden. „Big Data“ stellt somit auch in der öffentlichen Verwaltung eine immer größere Herausforderung dar. Sowohl durch eine umfangreiche Erhebung von Statistiken, als auch durch Dokumente wie Berichte und Studien, wachsen in Behörden die zu bewältigenden Informationsaufgaben. Darüber hinaus spielt die Berücksichtigung von Bürgermeinungen, vor allem auf kommunaler Ebene, eine immer größere Rolle. Eine Auswertung ohne moderne Informationstechnik ist dabei kaum mehr möglich. Damit aber aus diesen Daten tatsächlich die relevanten Informationen extrahiert werden, bedarf es Informationsvisualisierung und Visual Analytics Systeme die sehr detaillierte, aber dennoch einfache und schnelle Analysen für den Menschen erlauben. Dies stellt aber sehr hohe Anforderungen an die visuellen Systeme, da sie gleichzeitig auch den Nutzer und dessen Fähigkeiten berücksichtigen müssen. | ||
2016 |
||||
| 14. |  | Nazemi, Kawa; Steiger, Martin; Burkhardt, Dirk; Kohlhammer, Jörn Information Visualization and Policy Modeling Book Chapter In: Big Data: Concepts, Methodologies, Tools, and Applications, Chapter 8, pp. 139-180, IGI Global, Hershey, PA, USA, 2016, ISBN: 9781466698406. Abstract | Links | BibTeX | Dimensions | PlumX | Tags: Adaptation, Adaptive Visualization, Information Visualization, Semantics, Semantics Visualization, SemaVis, Visual Analytics @inbook{Nazemi2016,Policy design requires the investigation of various data in several design steps for making the right decisions, validating, or monitoring the political environment. The increasing amount of data is challenging for the stakeholders in this domain. One promising way to access the “big data” is by abstracted visual patterns and pictures, as proposed by information visualization. This chapter introduces the main idea of information visualization in policy modeling. First abstracted steps of policy design are introduced that enable the identification of information visualization in the entire policy life-cycle. Thereafter, the foundations of information visualization are introduced based on an established reference model. The authors aim to amplify the incorporation of information visualization in the entire policy design process. Therefore, the aspects of data and human interaction are introduced, too. The foundation leads to description of a conceptual design for social data visualization, and the aspect of semantics plays an important role. | ||
2015 |
||||
| 13. |  | Nazemi, Kawa; Retz, Reimond; Burkhardt, Dirk; Kuijper, Arjan; Kohlhammer, Jörn; Fellner, Dieter W. Visual Trend Analysis with Digital Libraries Proceedings Article In: Proceedings of the 15th International Conference on Knowledge Technologies and Data-driven Business, pp. 14:1–14:8, ACM, New York, NY, USA, 2015, ISBN: 978-1-4503-3721-2, (Honorable Mention of the Demo). Abstract | Links | BibTeX | Dimensions | PlumX | Tags: Data Mining, Information Extraction, Information Visualization, Trend Analysis, Visual Analytics @inproceedings{Nazemi2015c,The early awareness of new technologies and upcoming trends is essential for making strategic decisions in enterprises and research. Trends may signal that technologies or related topics might be of great interest in the future or obsolete for future directions. The identification of such trends premises analytical skills that can be supported through trend mining and visual analytics. Thus the earliest trends or signals commonly appear in science, the investigation of digital libraries in this context is inevitable. However, digital libraries do not provide sufficient information for analyzing trends. It is necessary to integrate data, extract information from the integrated data and provide effective interactive visual analysis tools. We introduce in this paper a model that investigates all stages from data integration to interactive visualization for identifying trends and analyzing the market situation through our visual trend analysis environment. Our approach improves the visual analysis of trends by investigating the entire transformation steps from raw and structured data to visual representations. | ||
| 12. |  | Burkhardt, Dirk; Nazemi, Kawa; Ginters, Egils; Aizstrauts, Artis; Kohlhammer, Jörn Explorative Visualization of Impact Analysis for Policy Modeling by Bonding Open Government and Simulation Data Proceedings Article In: Yamamoto, Sakae (Ed.): Human Interface and the Management of Information. Information and Knowledge Design, pp. 34–45, Springer International Publishing, Switzerland, 2015, ISBN: 978-3-319-20612-7. Abstract | Links | BibTeX | Dimensions | PlumX | Tags: Decision Making, Impact Analysis, Information Visualization, Open Government Data, Policy Modeling, Simulation, Visual Analysis @inproceedings{Burkhardt2015,Problem identification and solution finding are major challenges in policy modeling. Statistical indicator-data build the foundation for most of the required analysis work. In particular finding effective and efficient policies that solve an existing political problem is critical, since the forecast validation of the effectiveness is quite difficult. Simulation technologies can help to identify optimal policies for solutions, but nowadays many of such simulators are stand-alone technologies. In this paper we introduce a new visualization approach to enable the coupling of statistical indicator data from Open Government Data sources with simulators and especially simulation result data with the goal to provide an enhanced impact analysis for political analysts and decision makers. This allows, amongst others a more intuitive and effective way of solution finding. | ||
| 11. |  | Nazemi, Kawa; Burkhardt, Dirk; Hoppe, David; Nazemi, Mariam; Kohlhammer, Jörn Web-based Evaluation of Information Visualization Journal Article In: Procedia Manufacturing. 6th International Conference on Applied Human Factors and Ergonomics (AHFE 2015) and the Affiliated Conferences, vol. 3, pp. 5527–5534, 2015, ISSN: 2351-9789. Abstract | Links | BibTeX | Dimensions | PlumX | Tags: Evaluation Methods, Evaluation Tools, Human Perception, Information Visualization, User Study, Web-based Evaluation @article{Nazemi2015,Information visualization is strongly related to human perception, human behavior, and in particular human interaction. It is a discipline that focuses on human to enable him gathering insights, knowledge, and solving various and heterogeneous tasks. The human-centered characteristic of information visualization requires valid and proper user studies that improve the system or validate their benefits. New methods, techniques, or approaches of information visualization are commonly evaluated. However, the evaluation is either time and cost consuming or they are made minimum resources that leads to results, which may not be valid. In particular the number of participants is commonly restricted and does not enable a valid assumption about the results. Thus performance measures plays a key role in information visualization, existing web-survey tools are not convenient. We introduce in this paper a new method that enables web-based evaluations of information visualization systems. Our main contribution is the enhancement of web-based survey tools with performance measures. Our approach enables the measurement of task-completion time, correctness of solved tasks, and includes a number of pre- and post-questionnaires. | ||
2014 |
||||
| 10. |  | Nazemi, Kawa; Burkhardt, Dirk; Retz, Wilhelm; Kohlhammer, Jörn Adaptive Visualization of Social Media Data for Policy Modeling Proceedings Article In: Bebis, George; Boyle, Richard; Parvin, Bahram; Koracin, Darko; McMahan, Ryan; Jerald, Jason; Zhang, Hui; Drucker, Steven M.; Kambhamettu, Chandra; Choubassi, Maha El; Deng, Zhigang; Carlson, Mark (Ed.): Advances in Visual Computing. ISVC 2014, pp. 333–344, Springer International Publishing, Switzerland, 2014, ISBN: 978-3-319-14249-4. Abstract | Links | BibTeX | Dimensions | PlumX | Tags: Information Visualization, Policy Modeling, Search Paradigm, Social Media Data, Visual Variable @inproceedings{Nazemi2014b,The visual analysis of social media data emerged a huge number of interactive visual representations that use different characteristics of the data to enable the process of information acquisition. The social data are used in the domain of policy modeling to gather information about citizens' demands, opinions, and requirements and help to decide about political policies. Although existing systems already provide a huge number of visual analysis tools, the search and exploration paradigm is not really clear. Furthermore, the systems commonly do not provide any kind of human centered adaptation for the different stakeholders involved in the policy making process. In this paper, we introduce a novel approach that investigates the exploration and search paradigm from two different perspectives and enables a visual adaptation to support the exploration and analysis process. | ||
| 9. | | Nazemi, Kawa; Burkhardt, Dirk; Retz, Reimond; Kuijper, Arjan; Kohlhammer, Jörn Adaptive Visualization of Linked-Data Proceedings Article In: Bebis, George; Boyle, Richard; Parvin, Bahram; Koracin, Darko; McMahan, Ryan; Jerald, Jason; Zhang, Hui; Drucker, Steven M.; Kambhamettu, Chandra; Choubassi, Maha El; Deng, Zhigang; Carlson, Mark (Ed.): Advances in Visual Computing. ISVC 2014, pp. 872–883, Springer International Publishing, Switzerland, 2014, ISBN: 978-3-319-14364-4. Abstract | Links | BibTeX | Dimensions | PlumX | Tags: Application Scenario, Information Visualization, User Model, Visual Representation, Visual Search @inproceedings{Nazemi2014,Adaptive visualizations reduces the required cognitive effort to comprehend interactive visual pictures and amplify cognition. Although the research on adaptive visualizations grew in the last years, the existing approaches do not consider the transformation pipeline from data to visual representation for a more efficient and effective adaptation. Further todays systems commonly require an initial training by experts from the field and are limited to adaptation based either on user behavior or on data characteristics. A combination of both is not proposed to our knowledge. This paper introduces an enhanced instantiation of our previously proposed model that combines both: involving different influencing factors for and adapting various levels of visual peculiarities, on content, visual layout, visual presentation, and visual interface. Based on data type and users’ behavior, our system adapts a set of applicable visualization types. Moreover, retinal variables of each visualization type are adapted to meet individual or canonical requirements on both, data types and users’ behavior. Our system does not require an initial expert modeling. | ||
| 8. |  | Burkhardt, Dirk; Nazemi, Kawa; Retz, Wilhelm; Kohlhammer, Jörn Visual Explanation of Government-Data for Policy Making through Open-Data Inclusion Proceedings Article In: The 9th International Conference for Internet Technology and Secured Transactions (ICITST-2014), pp. 83-89, Infonomics Society IEEE, Piscataway, NJ, USA, 2014, ISBN: 978-1-908320-39-1. Abstract | Links | BibTeX | Dimensions | PlumX | Tags: Decision Making, e-Government, Information Visualization, Linked-Open Data Visualization, Open Government Data Visualization, Policy Modeling, Rule Generation @inproceedings{Burkhardt2014c,Commonly, data used in public authorities are statistical data about certain indicator. Such valid kind of data allows an objective observation about indicator developments over time. In case of a significant deviation from the normal indicator level, it is difficult to understand the reasons for upcoming problems. In our paper we present an approach that allows an enhanced information gathering through an improved information overview about the depending aspects to such an indicator by considering governmental data-sources that provide also other types of data than just statistics. Even more, our approach integrates a system that allows generating explanations for Open Government Data, especially to specific indicators, based on Linked-Open Data. This enables decision-makers to get hints for unexpected reasons of concrete problems that may influence an indicator. | ||
| 7. |  | Nazemi, Kawa; Steiger, Martin; Burkhardt, Dirk; Kohlhammer, Jörn Information Visualization and Policy Modeling Book Chapter In: Sonntagbauer, Peter; Nazemi, Kawa; Sonntagbauer, Susanne; Prister, Giorgio; Burkhardt, Dirk (Ed.): Handbook of Research on Advanced ICT Integration for Governance and Policy Modeling, Chapter 11, pp. 175–215, IGI Global, Hershey, PA, USA, 2014, ISBN: 9781466662360. Abstract | Links | BibTeX | Dimensions | PlumX | Tags: Adaptation, Adaptive Visualization, Information Visualization, Semantics, Semantics Visualization, SemaVis, Visual Analytics @inbook{Nazemi2014c,Policy design requires the investigation of various data in several design steps for making the right decisions, validating, or monitoring the political environment. The increasing amount of data is challenging for the stakeholders in this domain. One promising way to access the “big data” is by abstracted visual patterns and pictures, as proposed by information visualization. This chapter introduces the main idea of information visualization in policy modeling. First abstracted steps of policy design are introduced that enable the identification of information visualization in the entire policy life-cycle. Thereafter, the foundations of information visualization are introduced based on an established reference model. The authors aim to amplify the incorporation of information visualization in the entire policy design process. Therefore, the aspects of data and human interaction are introduced, too. The foundation leads to description of a conceptual design for social data visualization, and the aspect of semantics plays an important role. | ||
| 6. |  | Burkhardt, Dirk; Nazemi, Kawa; Encarnacao, Jose Daniel; Retz, Wilhelm; Kohlhammer, Jörn Visualization Adaptation Based on Environmental Influencing Factors Proceedings Article In: Kurosu, Masaaki (Ed.): Human-Computer Interaction. Theories, Methods, and Tools. HCI 2014, pp. 411–422, Springer International Publishing, Switzerland, 2014, ISBN: 978-3-319-07233-3. Abstract | Links | BibTeX | Dimensions | PlumX | Tags: Adaptive Visualization, Information Visualization, Sensor Fusion, User Experience, User-Centered Interaction @inproceedings{Burkhardt2014,Working effectively with computer-based devices is challenging, especially under mobile conditions, due to the various environmental influences. In this paper a visualization adaptation approach is described, to support the user under discriminatory environmental conditions. For this purpose, a context model for environmental influencing factors is being defined. Based on this context model, an approach to adapt visualizations in regards of certain environmental influences is being evolved, such as the light intensity, air quality, or heavy vibrations. | ||
2012 |
||||
| 5. |  | Burkhardt, Dirk; Ruppert, Tobias; Nazemi, Kawa Towards Process-Oriented Information Visualization For Supporting Users Proceedings Article In: Proceedings of 15th International Conference on Interactive Collaborative Learning (ICL 2012), pp. 1-8, IEEE , Piscataway, NJ, USA, 2012, ISBN: 978-1-4673-2427-4. Abstract | Links | BibTeX | Dimensions | PlumX | Tags: Information Visualization, Process Management, Process Adaptation, Process Support, Process-oriented Information Visualization, User-Centered Interaction @inproceedings{Burkhardt2012b,Nowadays daily office work consists of dealing with big numbers of data and data sources, and furthermore of working with complex computer programs. In consequence many users have problems to use such programs effective and efficient. In particular beginners have significant problems to use the programs correctly due to complex functionality and interaction options. To avoid this overload of the user, the Information Visualization community has recently developed some approaches that aim to support the users. Unfortunately, these approaches are limited to one special aspect, and sometimes they are just appropriate for one special task. Thus, in this paper we introduce a process-oriented user-supporting approach. It allows selecting adequate supporting techniques in correlation to a performed process and activity to guide the user and help him to solve his task. Furthermore, we show the benefits of designing programs and applications, which implement process definitions for the existing tasks to provide the user with better process orientation. This guides the user through difficult and complex processes. | ||
| 4. |  | Stab, Christian; Nazemi, Kawa; Breyer, Matthias; Burkhardt, Dirk; Kohlhammer, Jörn Semantics Visualization for Fostering Search Result Comprehension Proceedings Article In: Simperl, Elena; Cimiano, Philipp; Polleres, Axel; Corcho, Oscar; Presutti, Valentina (Ed.): The Semantic Web: Research and Applications; Research and Applications. ESWC 2012, pp. 633–646, Springer, Berlin, Heidelberg, Germany, 2012, ISBN: 978-3-642-30284-8. Abstract | Links | BibTeX | Dimensions | PlumX | Tags: Information Visualization, Search User Interface, Semantic Search, SemaVis, Visual Query Enhancement @inproceedings{Stab2012,Current search engines present search results in an ordered list even if semantic technologies are used for analyzing user queries and the document contents. The semantic information that is used during the search result generation mostly remains hidden from the user although it significantly supports users in understanding why search results are considered as relevant for their individual query. The approach presented in this paper utilizes visualization techniques for offering visual feedback about the reasons the results were retrieved. It represents the semantic neighborhood of search results, the relations between results and query terms as well as the relevance of search results and the semantic interpretation of query terms for fostering search result comprehension. It also provides visual feedback for query enhancement. Therefore, not only the search results are visualized but also further information that occurs during the search processing is used to improve the visual presentation and to offer more transparency in search result generation. The results of an evaluation in a real application scenario show that the presented approach considerably supports users in assessment and decision-making tasks and alleviates information seeking in digital semantic knowledge bases. | ||
2011 |
||||
| 3. |  | Nazemi, Kawa; Breyer, Matthias; Stab, Christian; Burkhardt, Dirk; Fellner, Dieter W. Intelligent Exploration System - An Approach for User-Centered Exploratory Learning Proceedings Article In: Proceedings of Workshop of the EDEN Open Classroom 2011 Conference: Lifelong Learning in RURAL and Remote Areas, pp. 71–83, Pallini, Athens, Greece, 2011, ISBN: 978-960-473-323-1. Abstract | Links | BibTeX | Dimensions | PlumX | Tags: Information Visualization, Intelligent Tutoring Systems, Knowledge Discovery, Knowledge Exploration @inproceedings{Nazemi2018,The following paper describes the conceptual design of an Intelligent Exploration System (IES) that offers a user-adapted graphical environment of web-based knowledge repositories, to support and optimize the explorative learning. The paper starts with a short definition of learning by exploring and introduces the Intelligent Tutoring System and Semantic Technologies for developing such an Intelligent Exploration System. The IES itself will be described with a short overview of existing learner or user analysis methods, visualization techniques for exploring knowledge with semantics technology and the explanation of the characteristics of adaptation to offer a more efficient learning environment. | ||
| 2. |  | Burkhardt, Dirk; Nazemi, Kawa; Breyer, Matthias; Stab, Christian; Kuijper, Arjan SemaZoom: Semantics Exploration by Using a Layer-Based Focus and Context Metaphor Proceedings Article In: Kurosu, Masaaki (Ed.): Human Centered Design, pp. 491–499, Springer, Berlin, Heidelberg, Germany, 2011, ISBN: 978-3-642-21753-1. Abstract | Links | BibTeX | Dimensions | PlumX | Tags: Human-Computer-Interfaces, Information Visualization, Semantic Web, Semantics Visualization @inproceedings{Burkhardt2011b,The Semantic Web is a powerful technology for organizing the data in our information based society. The collection and organization of information is an important step for showing important information to interested people. But the usage of such semantic-based data sources depends on effective and efficient information visualizations. Currently different kinds of visualizations in general and visualization metaphors do exist. Many of them are also applied for semantic data source, but often they are designed for semantic web experts and neglecting the normal user and his perception of an easy useable visualization. This kind of user needs less information, but rather a reduced qualitative view on the data. These two aspects of large amount of existing data and one for normal users easy to understand visualization is often not reconcilable. In this paper we create a concept for a visualization to show a bigger set of information to such normal users without overstraining them, because of layer-based data visualization, next to an integration of a Focus and Context metaphor. | ||
| 1. |  | Stab, Christian; Nazemi, Kawa; Breyer, Matthias; Burkhardt, Dirk; Kuijper, Arjan Interacting with Semantics and Time Proceedings Article In: Jacko, Julie A. (Ed.): Human-Computer Interaction. Users and Applications, pp. 520–529, Springer, Berlin, Heidelberg, Germany, 2011, ISBN: 978-3-642-21619-0. Abstract | Links | BibTeX | Dimensions | PlumX | Tags: Information Visualization, Semantic Search, Semantic Visualization, Time-Dependent Ontology, Timeline Visualization @inproceedings{Stab2011,Time appears in many different semantic information systems like historical databases, multimedia systems or social communities as a common attribute. Beside the temporal information, the resources in these domains are categorized in a domain-specific schema and interconnected by semantic relations. Nevertheless, the high potential of these systems is not yet exhausted completely. Even today most of these knowledge systems present time-dependent semantic knowledge in textual form, what makes it difficult for the average user to understand temporal structures and dependencies. For bridging this gap between human and computer and for simplifying the exploration of time-dependent semantic knowledge, we developed a new interactive timeline visualization called SemaTime. The new designed temporal navigation concept offers an intuitive way for exploring and filtering time-depended resources. Additionally SemaTime offers navigation and visual filtering methods on the conceptual layer of the domain and is able to depict semantic relations. In this paper we describe the conceptual design of SemaTime and illustrate its application potentials in semantic search environments. | ||
2021 |
||||
| 22. | | Visual analytics for technology and innovation management: An interaction approach for strategic decisionmaking Journal Article In: Multimedia Tools and Applications, vol. 1198, 2021, ISSN: 1380-7501. | ||
2019 |
||||
| 21. | | A Visual Analytics Approach for Analyzing Technological Trends in Technology and Innovation Management Proceedings Article In: Bebis, George; Boyle, Richard; Parvin, Bahram; Koracin, Darko; Ushizima, Daniela; Chai, Sek; Sueda, Shinjiro; Lin, Xin; Lu, Aidong; Thalmann, Daniel; Wang, Chaoli; Xu, Panpan (Ed.): Advances in Visual Computing, pp. 283–294, Springer International Publishing, Cham, 2019, ISBN: 978-3-030-33723-0. | ||
| 20. | | A Mobile Visual Analytics Approach for Instant Trend Analysis in Mobile Contexts Proceedings Article In: 5th International Conference of the Virtual and Augmented Reality in Education (VARE2019), pp. 11–19, CAL-TEK SRL, Rende, Italy, 2019, ISBN: 978-88-85741-41-6, (Nominated for Best Paper Award). | ||
| 19. | | Visual Analytics for Analyzing Technological Trends from Text Proceedings Article In: 2019 23rd International Conference Information Visualisation (iV), pp. 191-200, IEEE, 2019, ISSN: 2375-0138, (Best Paper Award). | ||
| 18. | | Visual analytical dashboards for comparative analytical tasks – a case study on mobility and transportation Journal Article In: ICTE in Transportation and Logistics 2018 (ICTE 2018), vol. 149, pp. 138-150, 2019, ISSN: 1877-0509. | ||
2018 |
||||
| 17. | | Visualizing Law - A Norm-Graph Visualization Approach based on Semantic Legal Data Proceedings Article In: 4th International Conference of the Virtual and Augmented Reality in Education (VARE 2018), pp. 154-162, CAL-TEK SRL, Rende, Italy, 2018, ISBN: 978-1-5108-7222-6. | ||
| 16. | | Juxtaposing Visual Layouts – An Approach for Solving Analytical and Exploratory Tasks through Arranging Visual Interfaces Proceedings Article In: 4th International Conference of the Virtual and Augmented Reality in Education (VARE 2018), pp. 144-153, CAL-TEK SRL, Rende, Italy, 2018, ISBN: 978-1-5108-7222-6. | ||
2017 |
||||
| 15. | | Informationsvisualisierung und Visual Analytics zur Unterstützung von E-Government Prozessen Proceedings Article In: Bade, Korinna; Pietsch, Matthias; Raabe, Susanne; Schütz, Lars (Ed.): Technologische Trends im Spannungsfeld von Beteiligung – Entscheidung – Planung: Fachforum DIGITALES PLANEN und GESTALTEN 2017, pp. 29–38, Shaker Verlag, Aachen, Germany, 2017, ISBN: 978-3844054392. | ||
2016 |
||||
| 14. | | Information Visualization and Policy Modeling Book Chapter In: Big Data: Concepts, Methodologies, Tools, and Applications, Chapter 8, pp. 139-180, IGI Global, Hershey, PA, USA, 2016, ISBN: 9781466698406. | ||
2015 |
||||
| 13. | | Visual Trend Analysis with Digital Libraries Proceedings Article In: Proceedings of the 15th International Conference on Knowledge Technologies and Data-driven Business, pp. 14:1–14:8, ACM, New York, NY, USA, 2015, ISBN: 978-1-4503-3721-2, (Honorable Mention of the Demo). | ||
| 12. | | Explorative Visualization of Impact Analysis for Policy Modeling by Bonding Open Government and Simulation Data Proceedings Article In: Yamamoto, Sakae (Ed.): Human Interface and the Management of Information. Information and Knowledge Design, pp. 34–45, Springer International Publishing, Switzerland, 2015, ISBN: 978-3-319-20612-7. | ||
| 11. | | Web-based Evaluation of Information Visualization Journal Article In: Procedia Manufacturing. 6th International Conference on Applied Human Factors and Ergonomics (AHFE 2015) and the Affiliated Conferences, vol. 3, pp. 5527–5534, 2015, ISSN: 2351-9789. | ||
2014 |
||||
| 10. | | Adaptive Visualization of Social Media Data for Policy Modeling Proceedings Article In: Bebis, George; Boyle, Richard; Parvin, Bahram; Koracin, Darko; McMahan, Ryan; Jerald, Jason; Zhang, Hui; Drucker, Steven M.; Kambhamettu, Chandra; Choubassi, Maha El; Deng, Zhigang; Carlson, Mark (Ed.): Advances in Visual Computing. ISVC 2014, pp. 333–344, Springer International Publishing, Switzerland, 2014, ISBN: 978-3-319-14249-4. | ||
| 9. | | Adaptive Visualization of Linked-Data Proceedings Article In: Bebis, George; Boyle, Richard; Parvin, Bahram; Koracin, Darko; McMahan, Ryan; Jerald, Jason; Zhang, Hui; Drucker, Steven M.; Kambhamettu, Chandra; Choubassi, Maha El; Deng, Zhigang; Carlson, Mark (Ed.): Advances in Visual Computing. ISVC 2014, pp. 872–883, Springer International Publishing, Switzerland, 2014, ISBN: 978-3-319-14364-4. | ||
| 8. | | Visual Explanation of Government-Data for Policy Making through Open-Data Inclusion Proceedings Article In: The 9th International Conference for Internet Technology and Secured Transactions (ICITST-2014), pp. 83-89, Infonomics Society IEEE, Piscataway, NJ, USA, 2014, ISBN: 978-1-908320-39-1. | ||
| 7. | | Information Visualization and Policy Modeling Book Chapter In: Sonntagbauer, Peter; Nazemi, Kawa; Sonntagbauer, Susanne; Prister, Giorgio; Burkhardt, Dirk (Ed.): Handbook of Research on Advanced ICT Integration for Governance and Policy Modeling, Chapter 11, pp. 175–215, IGI Global, Hershey, PA, USA, 2014, ISBN: 9781466662360. | ||
| 6. | | Visualization Adaptation Based on Environmental Influencing Factors Proceedings Article In: Kurosu, Masaaki (Ed.): Human-Computer Interaction. Theories, Methods, and Tools. HCI 2014, pp. 411–422, Springer International Publishing, Switzerland, 2014, ISBN: 978-3-319-07233-3. | ||
2012 |
||||
| 5. | | Towards Process-Oriented Information Visualization For Supporting Users Proceedings Article In: Proceedings of 15th International Conference on Interactive Collaborative Learning (ICL 2012), pp. 1-8, IEEE , Piscataway, NJ, USA, 2012, ISBN: 978-1-4673-2427-4. | ||
| 4. | | Semantics Visualization for Fostering Search Result Comprehension Proceedings Article In: Simperl, Elena; Cimiano, Philipp; Polleres, Axel; Corcho, Oscar; Presutti, Valentina (Ed.): The Semantic Web: Research and Applications; Research and Applications. ESWC 2012, pp. 633–646, Springer, Berlin, Heidelberg, Germany, 2012, ISBN: 978-3-642-30284-8. | ||
2011 |
||||
| 3. | | Intelligent Exploration System - An Approach for User-Centered Exploratory Learning Proceedings Article In: Proceedings of Workshop of the EDEN Open Classroom 2011 Conference: Lifelong Learning in RURAL and Remote Areas, pp. 71–83, Pallini, Athens, Greece, 2011, ISBN: 978-960-473-323-1. | ||
| 2. | | SemaZoom: Semantics Exploration by Using a Layer-Based Focus and Context Metaphor Proceedings Article In: Kurosu, Masaaki (Ed.): Human Centered Design, pp. 491–499, Springer, Berlin, Heidelberg, Germany, 2011, ISBN: 978-3-642-21753-1. | ||
| 1. | | Interacting with Semantics and Time Proceedings Article In: Jacko, Julie A. (Ed.): Human-Computer Interaction. Users and Applications, pp. 520–529, Springer, Berlin, Heidelberg, Germany, 2011, ISBN: 978-3-642-21619-0. | ||
Stay Tuned
Mind the following RSS feeds:
![]() Personal News
Personal News
![]() Personal Publications
Personal Publications