Presentation of Two Accepted Papers at VARE 2018
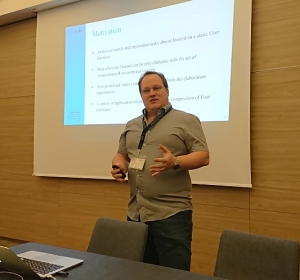
At the current conference in Virtual and Augmented Reality in Education (VARE 2018), we are happy to present two of our accepted interesting papers. The conference takes place from Sep. 17, 2018 to Sep. 21, 2018 in Budapest, Hungary. The VARE is a biannual event that brings together trainers in all areas of knowledge and educational levels as well as researchers and scientists from virtual technologies as well data advanced visualization and virtualization. In general, main aim is to improve teaching and training, and data analysis through virtual and augmented technologies use and to discuss problems and solutions in mentioned areas to identify new issues, and to shape future directions for research. The accepted papers are:
#1 Juxtaposing Visual Layouts – An Approach for Solving Analytical and Exploratory Tasks through Arranging Visual Interfaces
Interactive visualization and visual analytics systems enables solving a variety of tasks. Starting with simple search tasks for outliers, anomalies etc. in data to analytical comparison
s, information visualizations may lead to a faster and more precise solving of tasks. There exist a variety of methods to support users in the process of task solving, e.g. superimposing, juxtaposing or partitioning complex visual structures. Commonly all these methods make use of a single data source that is visualized at the same time. We propose in this paper an approach that goes beyond the established methods and enables visualizing different databases, data-sets and sub-sets of data with juxtaposed visual interfaces. Our approach should be seen as an expandable method. Our main contributions are an in-depth analysis of visual task models and an approach for juxtaposing visual layouts as visual interfaces to enable solving complex tasks.
#2 Visualizing Law – A Norm-Graph Visualization Approach based on Semantic Legal Data
Laws or in general legal documents regulate a wide range of our daily life and also define the borders of business models and commercial services.
However, legal text and laws are almost hard to understand. From other domains it is already known that visualizations can help understanding
complex aspects easier. In fact, in this paper we introduce a new approach to visualize legal texts in a Norm-graph visualization. In the developed Norm-graph visualization it is possible to show major aspects of laws and make it easier for users to understand it. The Norm-graph is based on semantic legal data, a so called Legal-Concept-Ontology.

 pixabay


 pixabay
Leave a Reply
Want to join the discussion?Feel free to contribute!