..:: Dirk Burkhardt ::..
  • Home
  • About me
    • CV
    • Networks
  • Research
    • Projects
    • Scientific Publications
    • Other Publications
    • Talks
  • Development
    • References at h_da
    • References at Software AG
  • Teaching
    • Theses
    • Seminars
    • Practical Courses
  • Click to open the search input field Click to open the search input field Search
  • Menu Menu

Tag Archive for: Visual Analytics

You are here: Home1 / Development2 / References at Software AG3 / Visual Analytics

Posts

Presenting CliCE-DiPP Results at the iV 2025

15/08/2025/in Events & Public Relations, News, Project, Publication, Research & Development, VIS Research Group/by Dirk Burkhardt

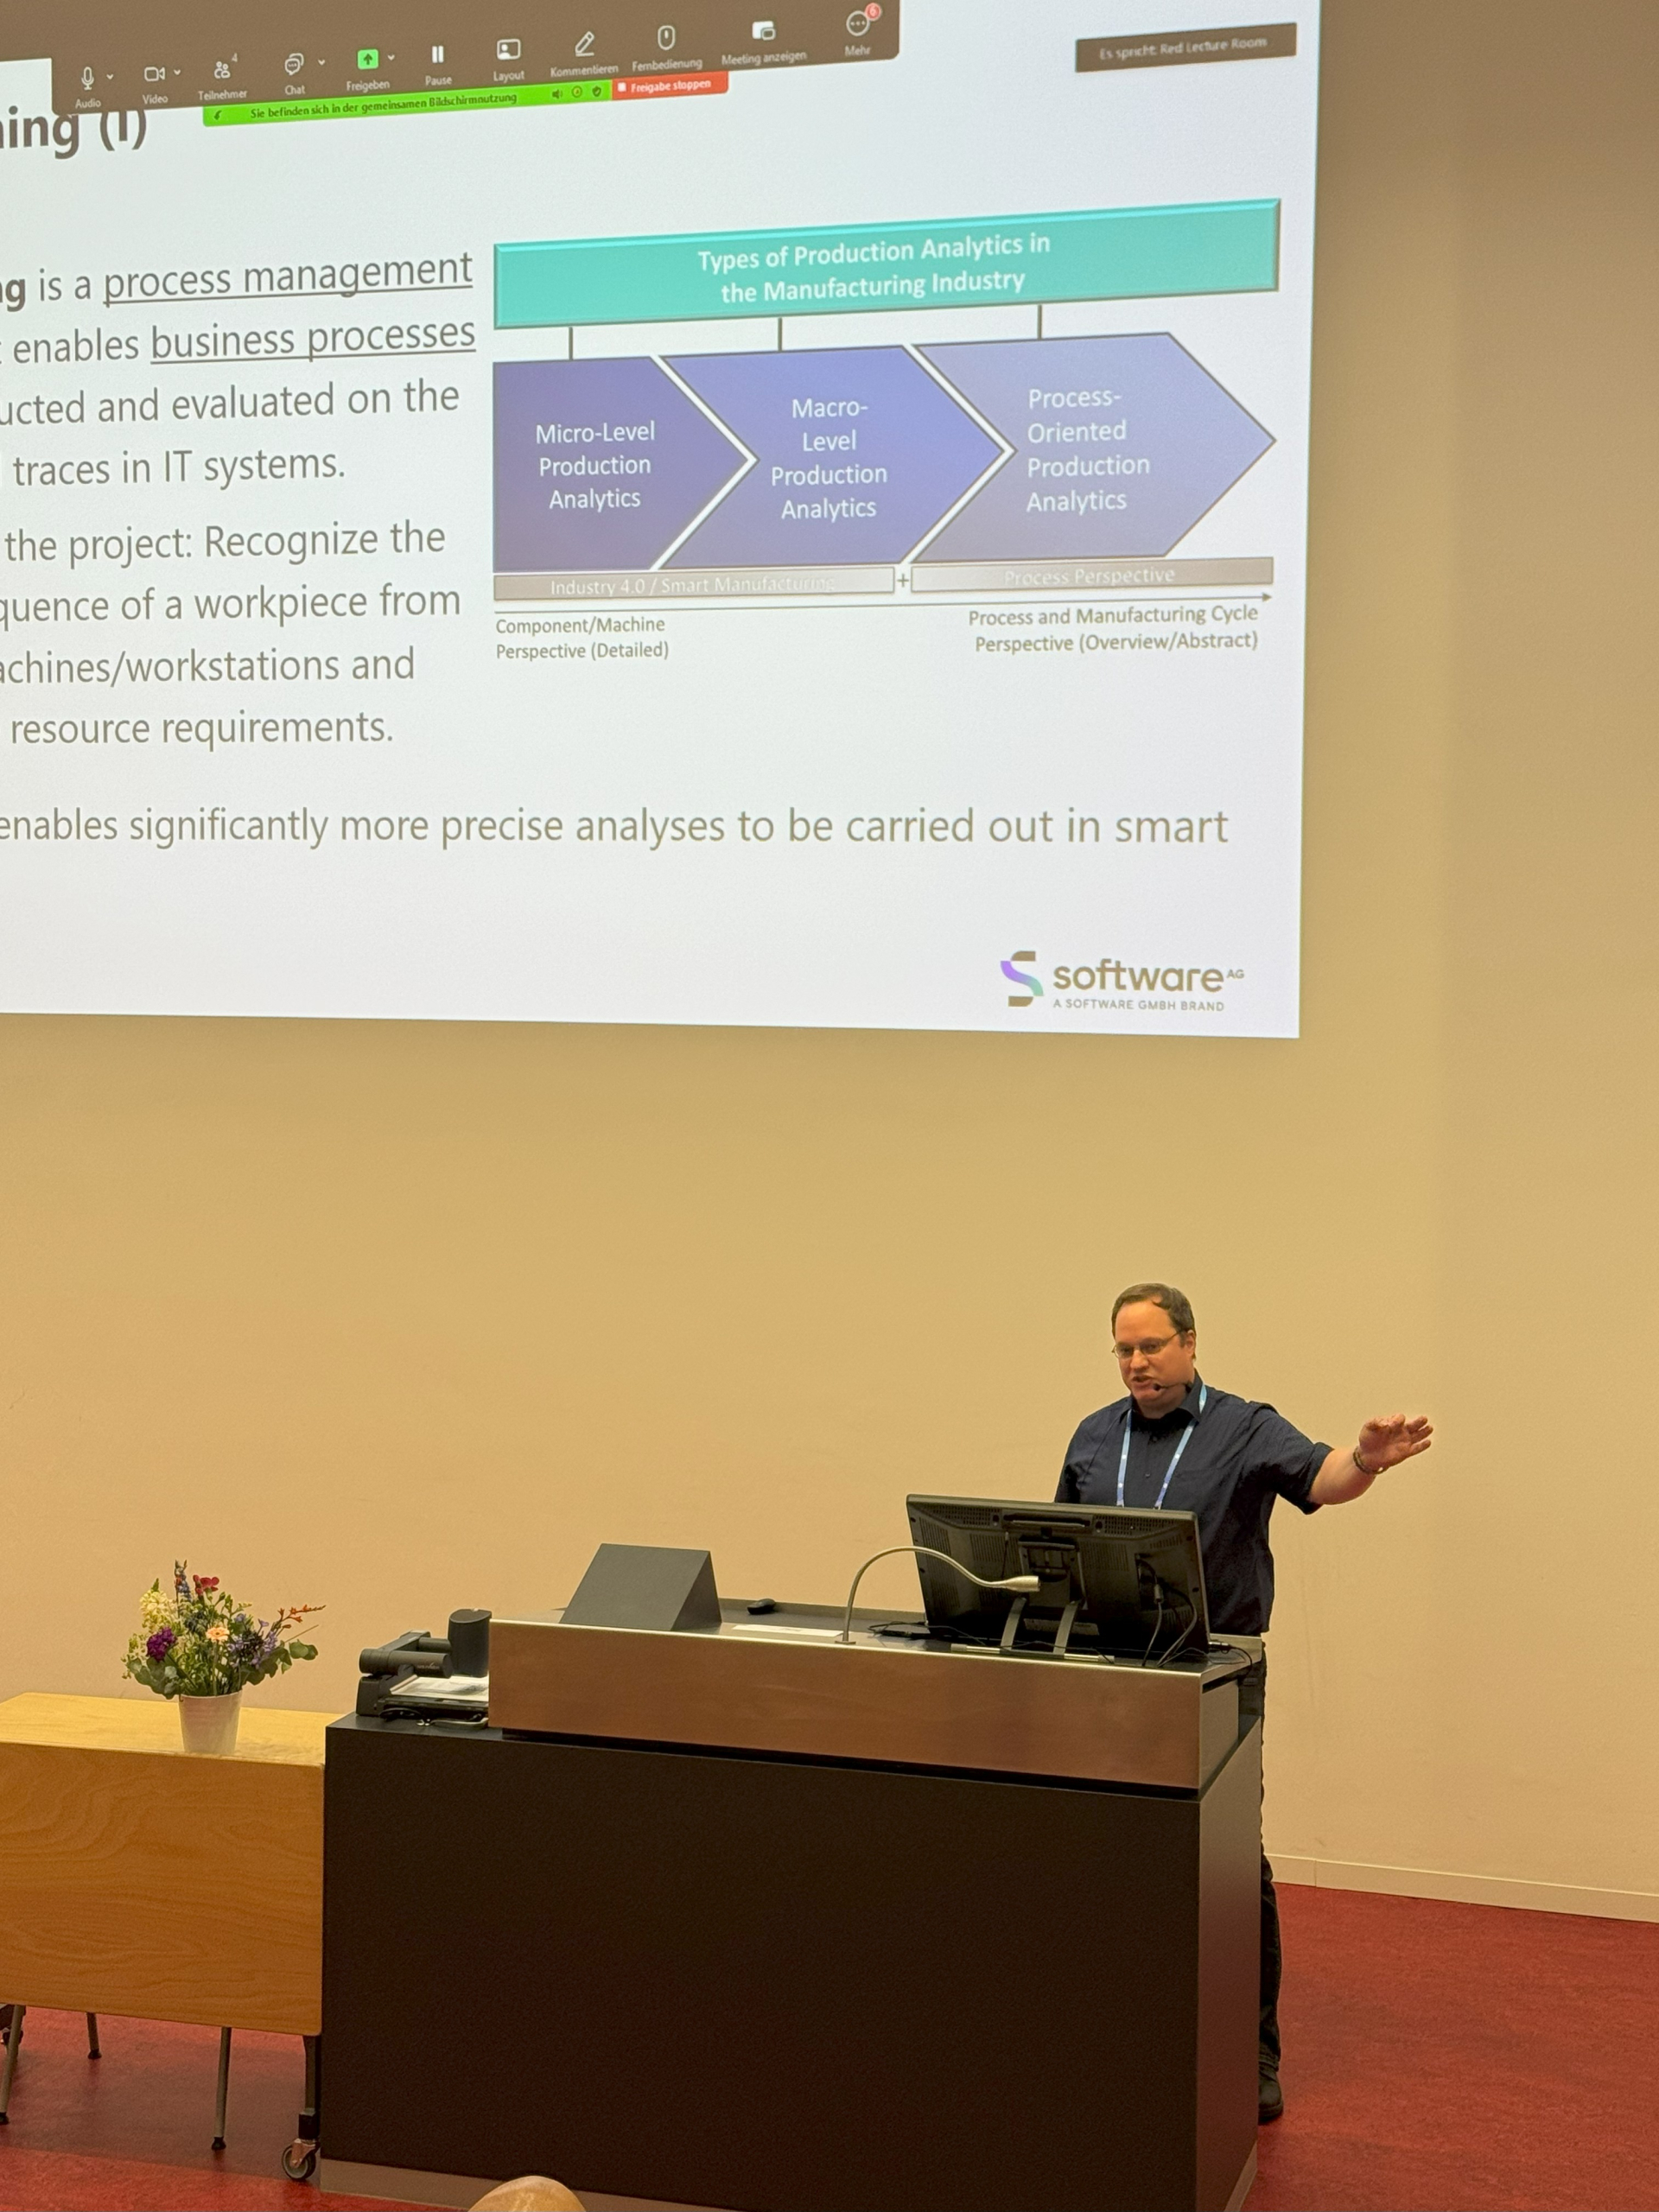
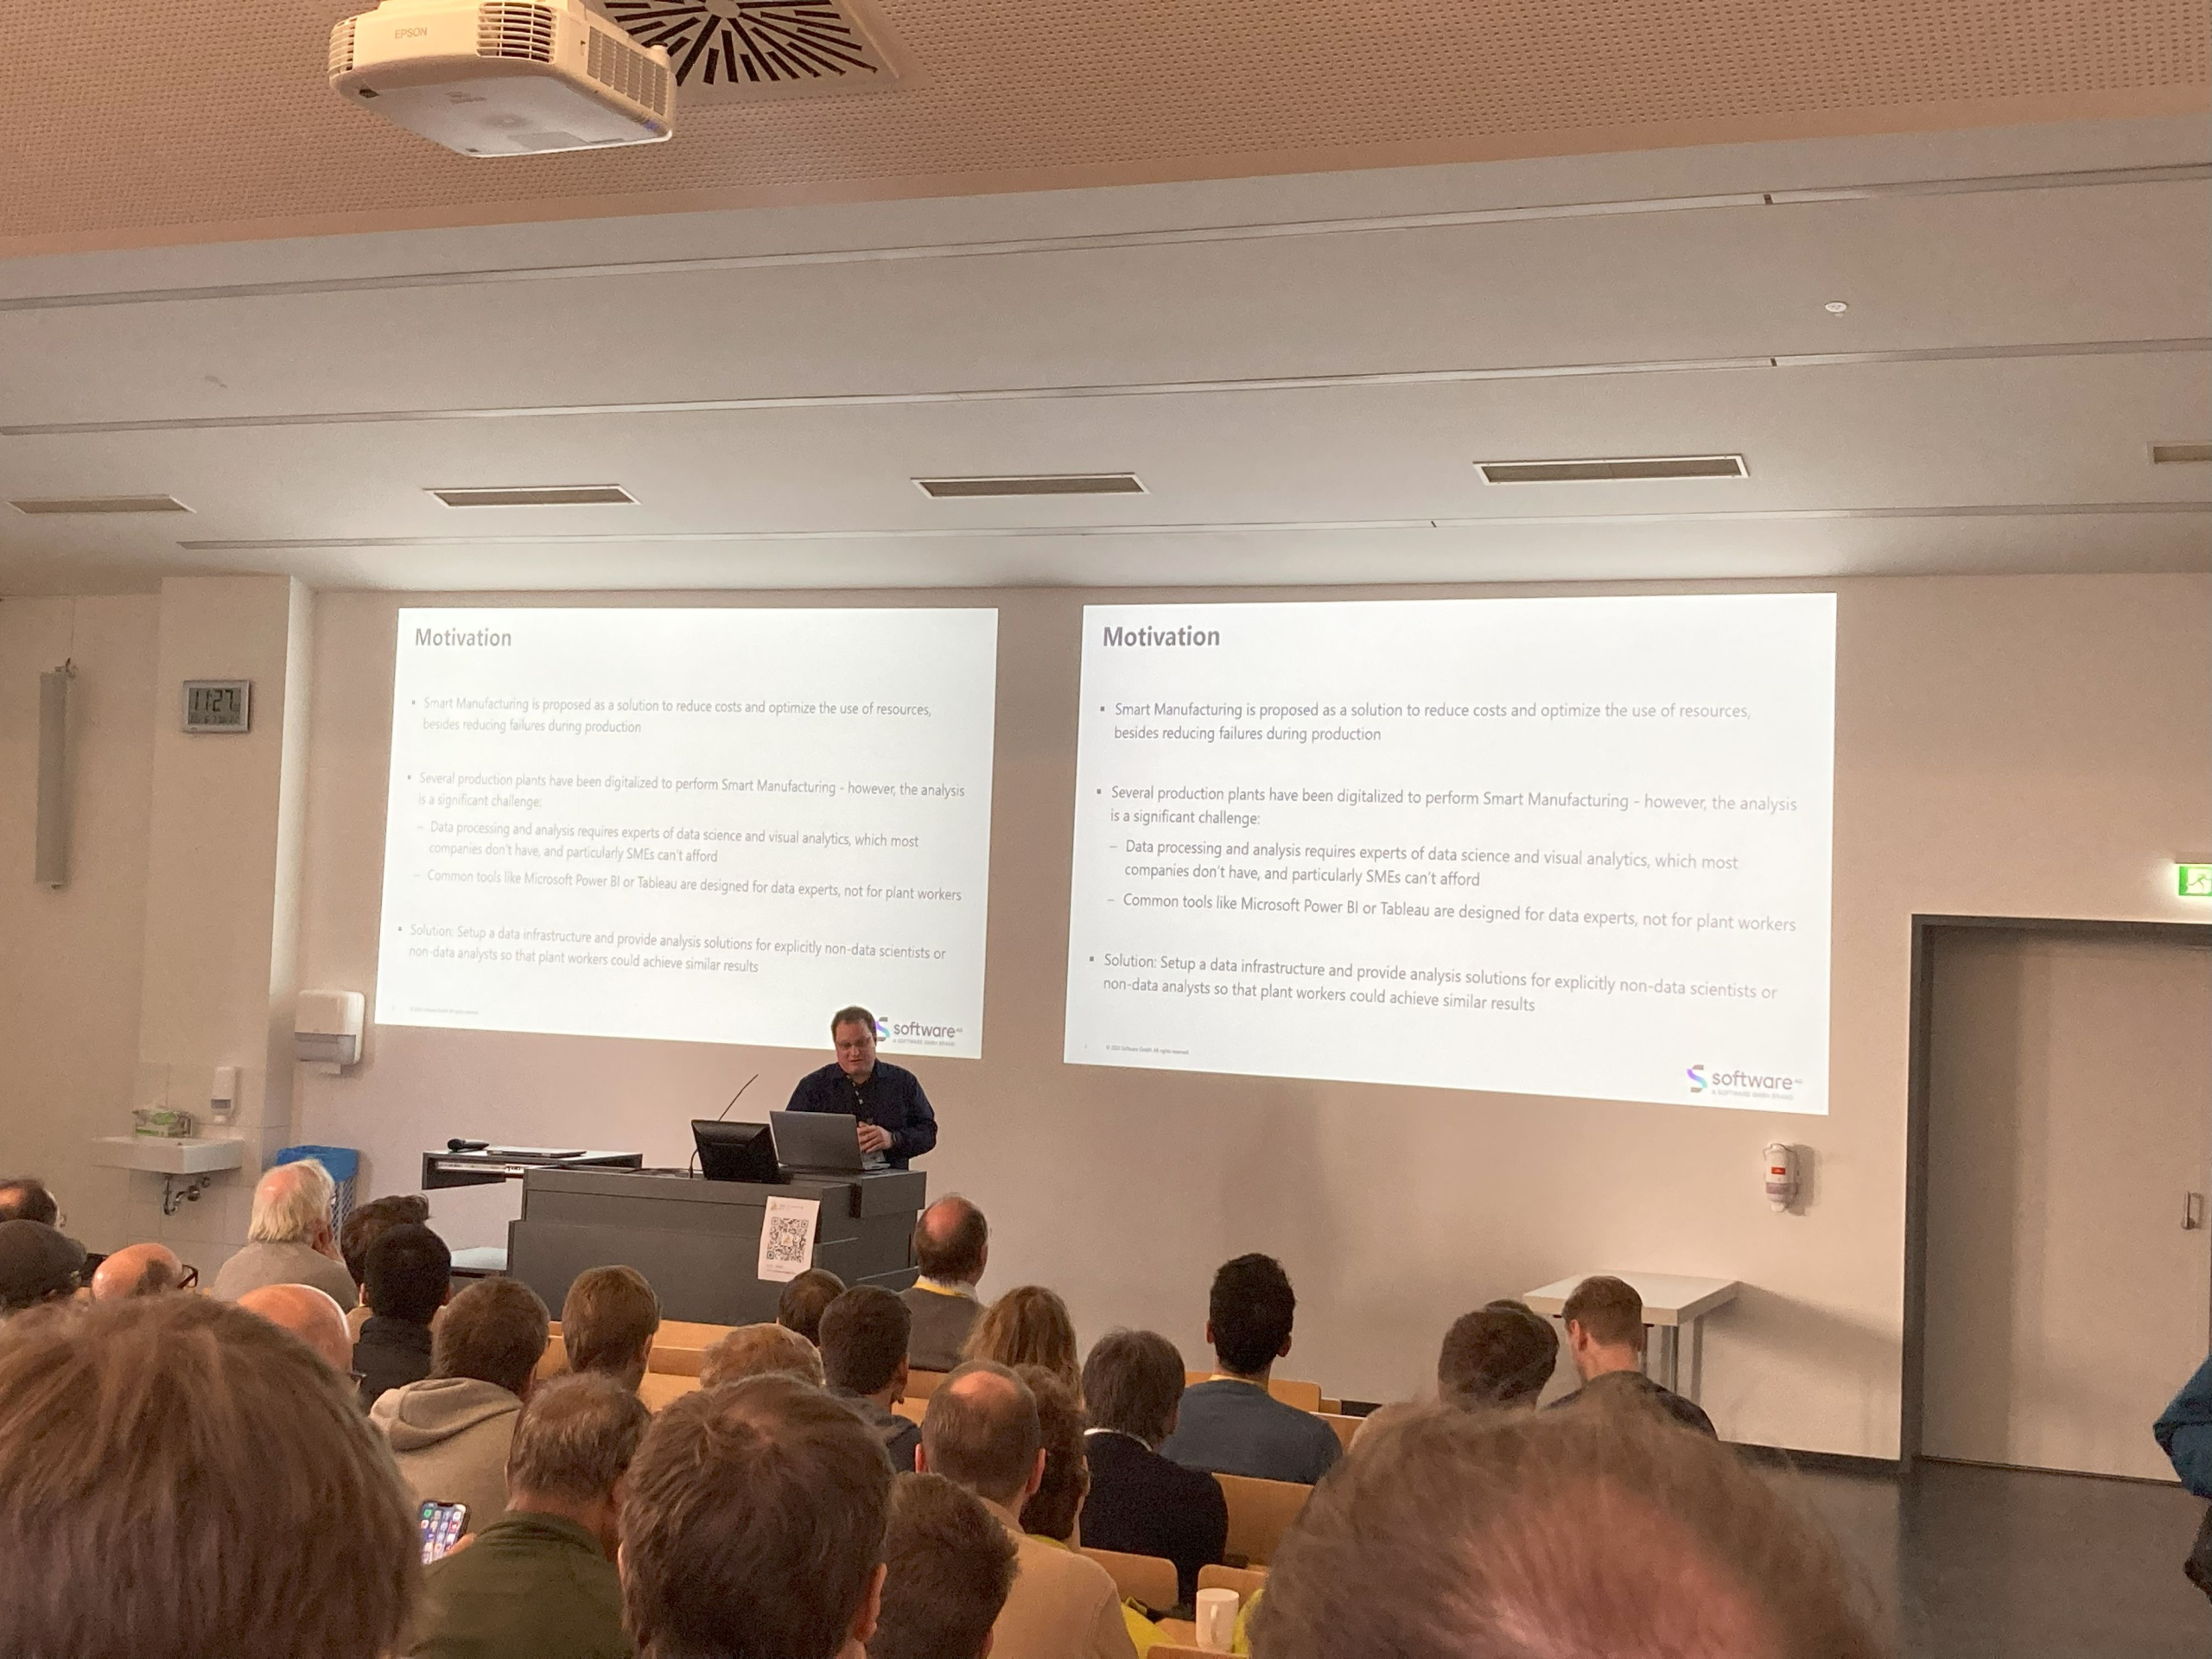
A week ago, I had the opportunity to present our latest results from the CliCE-DiPP research project at the iV conference in Darmstadt. It was about two analysis solutions around sustainable production. One paper[1] was about the analysis of resource consumption and CO2 emissions over the entire production cycle, using a new approach based on process mining. The second paper[2] dealt with the analysis of digital product passwords in terms of CO2 emissions over their entire life cycle.

The conference was also a nice reunion with a number of former colleagues and project partners. And of course, the conference offered lots of interesting presentations on AI and visualization as well as plenty of exciting talks and technical discussions.

The International Conference on Information Visualisation (iV) is a unique platform that brings together academia, industry researchers, and societal agencies. It offers a space to share practical solutions for multidisciplinary applications with societal impacts. Beyond the research forum, it hosts the Doctoral Research Programme for PhD training and a researchers link session for collaborative research project design, providing unparalleled opportunities for learning and collaboration.
The conference theme covers Information Visualization, Visual Analytics, and AI-centred Visual Knowledge Discovery. Its structure adapts to the subject’s evolving and developments. The focus is on applying these fields that have a societal impact, such as Knowledge Visualization, Learning Analytics, and Digital Humanities Knowledge Visualization.
References

  1. Dirk Burkhardt and Juliane Harbarth and Andreas Görmer (2025): Process Mining for Production Optimization in Smart Manufacturing. In: Banissi, Ebad; Datia, Nuno; Pires, João Moura; Ursyn, Anna; Nazemi, Kawa; Secco, Cristian A.; Kovalerchuk, Boris; Andonie, Razvan; Gavrilova, Marina; Nakayama, Minoru; Hascoet, Mountaz; Rusu, Amalia; Nguyen, Quang Vinh; Mabakane, Mabule Samuel; Rusu, Adrian; Hua, Jie; Bouali, Fatma; Venturini, Gilles; Dong, Alice; Kernbach, Sebastian; Cimin, Gaetano; Cvek, Urska; and Tony Huang, (Ed.): 2025 29th International Conference Information Visualisation (IV), pp. 288-295, IEEE, 2025, ISBN: 979-8-3315-7741-4.
  2. Dirk Burkhardt and Moritz Bock and Arjan Kuijper (2025): DPPviewer: A Visual Analytics Approach for Optimizing Production Chains on Digital Product Passports. In: Banissi, Ebad; Datia, Nuno; Pires, João Moura; Ursyn, Anna; Nazemi, Kawa; Secco, Cristian A.; Kovalerchuk, Boris; Andonie, Razvan; Gavrilova, Marina; Nakayama, Minoru; Hascoet, Mountaz; Rusu, Amalia; Nguyen, Quang Vinh; Mabakane, Mabule Samuel; Rusu, Adrian; Hua, Jie; Bouali, Fatma; Venturini, Gilles; Dong, Alice; Kernbach, Sebastian; Cimin, Gaetano; Cvek, Urska; and Tony Huang, (Ed.): 2025 29th International Conference Information Visualisation (IV), pp. 311-319, IEEE, 2025, ISBN: 979-8-3315-7741-4.
Two Paper Accepted at iV 2025 Conference

16/06/2025/in Events & Public Relations, News, Project, Publication, Research & Development/by Dirk Burkhardt

Today, I received the good news that my two submitted papers were accepted for this year’s International Conference on Information Visualisation, taking place in Darmstadt.
In the present information era, most aspects of our lives depend on and are driven by data, information, knowledge, user experience, and culture. Information Visualisation, Visual Analytics, Business Intelligence, Machine Learning, and Data Science are only a few research areas of the current state of the art, enabling to increase of the comprehension of the information on which is based the infrastructure of our society. The International Conference on Information Visualisation is concentrated on these hot topics.  As in the previous edition, this year, there will be the opportunity to start international cooperation and European research projects and discuss with international relevance keynote speakers. The conference is articulated in symposia, with details and further information available on the Symposia webpage.

The accepted papers present our latest works in the research project CliCE-DiPP toward:

  • Process Mining for Production Optimization in Smart Manufacturing[3], for which we developed a completely new approach that makes use of Process Mining in Manufacturing to simplify the collection of consumed resources to generate accurate Carbon Footprints for Digital Product Passports.
  • DPPviewer: A Visual Analytics Approach for Optimizing Production Chains on Digital Product Passports[4] is a generic solution to make Digital Product Passports human accessible and analyzable.

References

  1. Dirk Burkhardt and Juliane Harbarth and Andreas Görmer (2025): Process Mining for Production Optimization in Smart Manufacturing. In: Banissi, Ebad; Datia, Nuno; Pires, João Moura; Ursyn, Anna; Nazemi, Kawa; Secco, Cristian A.; Kovalerchuk, Boris; Andonie, Razvan; Gavrilova, Marina; Nakayama, Minoru; Hascoet, Mountaz; Rusu, Amalia; Nguyen, Quang Vinh; Mabakane, Mabule Samuel; Rusu, Adrian; Hua, Jie; Bouali, Fatma; Venturini, Gilles; Dong, Alice; Kernbach, Sebastian; Cimin, Gaetano; Cvek, Urska; and Tony Huang, (Ed.): 2025 29th International Conference Information Visualisation (IV), pp. 288-295, IEEE, 2025, ISBN: 979-8-3315-7741-4.
  2. Dirk Burkhardt and Moritz Bock and Arjan Kuijper (2025): DPPviewer: A Visual Analytics Approach for Optimizing Production Chains on Digital Product Passports. In: Banissi, Ebad; Datia, Nuno; Pires, João Moura; Ursyn, Anna; Nazemi, Kawa; Secco, Cristian A.; Kovalerchuk, Boris; Andonie, Razvan; Gavrilova, Marina; Nakayama, Minoru; Hascoet, Mountaz; Rusu, Amalia; Nguyen, Quang Vinh; Mabakane, Mabule Samuel; Rusu, Adrian; Hua, Jie; Bouali, Fatma; Venturini, Gilles; Dong, Alice; Kernbach, Sebastian; Cimin, Gaetano; Cvek, Urska; and Tony Huang, (Ed.): 2025 29th International Conference Information Visualisation (IV), pp. 311-319, IEEE, 2025, ISBN: 979-8-3315-7741-4.
  3. Dirk Burkhardt and Juliane Harbarth and Andreas Görmer (2025): Process Mining for Production Optimization in Smart Manufacturing. In: Banissi, Ebad; Datia, Nuno; Pires, João Moura; Ursyn, Anna; Nazemi, Kawa; Secco, Cristian A.; Kovalerchuk, Boris; Andonie, Razvan; Gavrilova, Marina; Nakayama, Minoru; Hascoet, Mountaz; Rusu, Amalia; Nguyen, Quang Vinh; Mabakane, Mabule Samuel; Rusu, Adrian; Hua, Jie; Bouali, Fatma; Venturini, Gilles; Dong, Alice; Kernbach, Sebastian; Cimin, Gaetano; Cvek, Urska; and Tony Huang, (Ed.): 2025 29th International Conference Information Visualisation (IV), pp. 288-295, IEEE, 2025, ISBN: 979-8-3315-7741-4.
  4. Dirk Burkhardt and Moritz Bock and Arjan Kuijper (2025): DPPviewer: A Visual Analytics Approach for Optimizing Production Chains on Digital Product Passports. In: Banissi, Ebad; Datia, Nuno; Pires, João Moura; Ursyn, Anna; Nazemi, Kawa; Secco, Cristian A.; Kovalerchuk, Boris; Andonie, Razvan; Gavrilova, Marina; Nakayama, Minoru; Hascoet, Mountaz; Rusu, Amalia; Nguyen, Quang Vinh; Mabakane, Mabule Samuel; Rusu, Adrian; Hua, Jie; Bouali, Fatma; Venturini, Gilles; Dong, Alice; Kernbach, Sebastian; Cimin, Gaetano; Cvek, Urska; and Tony Huang, (Ed.): 2025 29th International Conference Information Visualisation (IV), pp. 311-319, IEEE, 2025, ISBN: 979-8-3315-7741-4.

Final Project Review in E2COMATION

03/04/2025/in Events & Public Relations, News, Project, Research & Development, Software AG/by Dirk Burkhardt

Last week, we had our last and final project review of the European research project E2COMATION. As usual in such projects, the last view month required a lot of attention to complete the last works, deliverables, and of course the administrative reporting. And now, it was to show the achievements to the EU project officer and the reviewers.

After the preparation day, we had a full day to show all our achievements and answer questions. As might be noted, in such a big project with big industrial actors as use cases, there were a lot of challenges to be solved and alternative strategies and solutions to be elaborated on to achieve the intended innovations. The technical challenges and the delays due to the COVID-19 pandemic finally led to a project extension for approx. 1,5 years.

As Software AG, we are responsible for the two tasks. The first part was presenting the self-analytics platform for plant workers for what we use TrendMiner and this was on me. The goal of this task is to give production workers, who are not data scientists, the ability to analyze IoT data from the shop floor and identify problems, solutions, and optimizations. The second part was about real-time analytics together with our solution APAMA, which my colleague presented. Together with some principle architectural information, we also gave demos to show how the solutions are practically used in the use cases.

To summarize the project for me: It was indeed challenging in more ways than one. But on the other hand, the project fundamentally immersed me in the topic of Smart Manufacturing and IoT Analytics, and I hope to continue working and researching in this field in the future. It was also exciting to come into contact with so many experts in the field and to have intensive yet constructive discussions (both technical and perspective).

Presenting E2COMATION Results at the BTW 2025

10/03/2025/in Events & Public Relations, News, Project, Publication, Research & Development/by Dirk Burkhardt

I’m glad to have had the opportunity to present our paper at BTW 2025 last week. In the paper, we could outline one of our main contributions in the finishing European research project E2COMATION, how we could enable plant workers to perform their own (visual) analytics on shopfloor data for smart manufacturing. With my colleagues Harald, Mohamed, and Kanishk, it was a special experience to participate in the conference.

The BTW conference is the most important database conference in the German-speaking area. Every two years since 1985, it has served as a central forum for the exchange of information between scientists, practitioners, and users on topics of database and information system technology. Focus topics are data integration and extraction, provenance management, data protection, scalable big data analytics, hardware technologies on a small scale up to cloud computing as well as new application areas and architectural approaches for the support of machine learning in the context of artificial intelligence.

More information about our paper, titled “Enabling Smart Manufacturing with Visual Analytics for Plant Workers”[5]
Abstract: Smart manufacturing is increasingly making use of visual analytics to optimize production or to identify early problem signs. However, current solutions and approaches require professionals, especially from the data science area, to make use of it, which is not affordable for most production companies. In this paper, we describe first a best practice to sensorize plants from the wood and beverage industry to enable smart manufacturing in general. Second, we describe a new approach that aims at providing easy-to-use visual analytics functionalities that are designed to be used directly by plant workers. Plant workers usually have encompassing experience in the production and the plant, but lack of computer experience and corresponding mathematical knowledge for data analysis. Through lowering the barriers for plant workers in performing data analysis of the IoT sensors with simplified and almost automated analysis functions would give them the ability to gain insights into the production and achieve similar production optimizations and problem preventions as data science experts could. The main contributions of this article are on the one hand the best practice of how production lines of the wood and beverage industry could be made ready for smart manufacturing, but also an approach that enables non-data scientists, especially plant workers, to perform sufficient analysis about optimal production settings and early problem cause identification.

References

  1. Dirk Burkhardt and Juliane Harbarth and Andreas Görmer (2025): Process Mining for Production Optimization in Smart Manufacturing. In: Banissi, Ebad; Datia, Nuno; Pires, João Moura; Ursyn, Anna; Nazemi, Kawa; Secco, Cristian A.; Kovalerchuk, Boris; Andonie, Razvan; Gavrilova, Marina; Nakayama, Minoru; Hascoet, Mountaz; Rusu, Amalia; Nguyen, Quang Vinh; Mabakane, Mabule Samuel; Rusu, Adrian; Hua, Jie; Bouali, Fatma; Venturini, Gilles; Dong, Alice; Kernbach, Sebastian; Cimin, Gaetano; Cvek, Urska; and Tony Huang, (Ed.): 2025 29th International Conference Information Visualisation (IV), pp. 288-295, IEEE, 2025, ISBN: 979-8-3315-7741-4.
  2. Dirk Burkhardt and Moritz Bock and Arjan Kuijper (2025): DPPviewer: A Visual Analytics Approach for Optimizing Production Chains on Digital Product Passports. In: Banissi, Ebad; Datia, Nuno; Pires, João Moura; Ursyn, Anna; Nazemi, Kawa; Secco, Cristian A.; Kovalerchuk, Boris; Andonie, Razvan; Gavrilova, Marina; Nakayama, Minoru; Hascoet, Mountaz; Rusu, Amalia; Nguyen, Quang Vinh; Mabakane, Mabule Samuel; Rusu, Adrian; Hua, Jie; Bouali, Fatma; Venturini, Gilles; Dong, Alice; Kernbach, Sebastian; Cimin, Gaetano; Cvek, Urska; and Tony Huang, (Ed.): 2025 29th International Conference Information Visualisation (IV), pp. 311-319, IEEE, 2025, ISBN: 979-8-3315-7741-4.
  3. Dirk Burkhardt and Juliane Harbarth and Andreas Görmer (2025): Process Mining for Production Optimization in Smart Manufacturing. In: Banissi, Ebad; Datia, Nuno; Pires, João Moura; Ursyn, Anna; Nazemi, Kawa; Secco, Cristian A.; Kovalerchuk, Boris; Andonie, Razvan; Gavrilova, Marina; Nakayama, Minoru; Hascoet, Mountaz; Rusu, Amalia; Nguyen, Quang Vinh; Mabakane, Mabule Samuel; Rusu, Adrian; Hua, Jie; Bouali, Fatma; Venturini, Gilles; Dong, Alice; Kernbach, Sebastian; Cimin, Gaetano; Cvek, Urska; and Tony Huang, (Ed.): 2025 29th International Conference Information Visualisation (IV), pp. 288-295, IEEE, 2025, ISBN: 979-8-3315-7741-4.
  4. Dirk Burkhardt and Moritz Bock and Arjan Kuijper (2025): DPPviewer: A Visual Analytics Approach for Optimizing Production Chains on Digital Product Passports. In: Banissi, Ebad; Datia, Nuno; Pires, João Moura; Ursyn, Anna; Nazemi, Kawa; Secco, Cristian A.; Kovalerchuk, Boris; Andonie, Razvan; Gavrilova, Marina; Nakayama, Minoru; Hascoet, Mountaz; Rusu, Amalia; Nguyen, Quang Vinh; Mabakane, Mabule Samuel; Rusu, Adrian; Hua, Jie; Bouali, Fatma; Venturini, Gilles; Dong, Alice; Kernbach, Sebastian; Cimin, Gaetano; Cvek, Urska; and Tony Huang, (Ed.): 2025 29th International Conference Information Visualisation (IV), pp. 311-319, IEEE, 2025, ISBN: 979-8-3315-7741-4.
  5. Dirk Burkhardt and Gerald Ristow (2025): Enabling Smart Manufacturing with Visual Analytics for Plant Workers. In: Klettke, Meike; Schenkel, Ralf; Henrich, Andreas; Nicklas, Daniela; Schüle, Maximilian E.; Meyer-Wegener, Klaus (Ed.): Datenbanksysteme für Business, Technologie und Web (BTW 2025), pp. 665-678, Gesellschaft für Informatik, Bonn, 2025, ISSN: 2944-7682.

Moritz Bock defended his Master Thesis on Visual Analytics on Digital Product Passports to Optimize Production Chains

16/12/2024/in Interactive Graphics Systems Group, News, Research, Research & Development, Software AG, Teaching, TU Darmstadt/by Dirk Burkhardt

In his thesis, Moritz Bock developed a concept that comprises a human-centered Visual Analytics approach, enabling users to analyze and simulate sustainability efforts over the whole production chain through interactive and intuitive visualizations. The Asset Administration Shell (AAS) was selected as the framework representing DPPs due to its viability, as determined by an analysis of its contents. The implementation encompasses a web-based Visual Analytics system, integrating a standardized interface into an AAS-based backend. The user interface provides tools to navigate available products, identify high-emitting products, track emissions, and identify specific life cycle stages or transport routes contributing to greenhouse gas emissions. Users can test the impact of changes, such as replacing components, on emissions.

Update: 11.06.2025

More details can now be found under: https://www.policymodelling.com/dppviewer

2nd Project Review in E2COMATION

07/02/2024/in Events & Public Relations, News, Project, Research & Development, Software AG/by Dirk Burkhardt

Last week we had our 2nd project review in the now three-year ongoing European research project E2COMATION. As usual in such projects, the last view month required a lot of attention to complete the last work actions, deliverables, and of course the administrative reporting. And now it was to show the achievements to the EU project officer and the reviewers.

After the preparation day, we had a full day to show all our achievements and answer questions. As might be noted, in such a big project with big industrial actors as use-cases there were a lot of challenges to be solved and also alternative strategies and solutions to be elaborated.

As Software AG we are responsible for the two tasks. The first was about real-time analytics together with our solution APAMA, which my colleague presented. The second part was presenting the self-analytics results for what we use TrendMiner and this was on me. The goal of this task is to give production workers, who are not data scientists, the ability to analyze IoT data from the shopfloor and identify problems, solutions, and optimizations. Together with some principle architectural information I also gave a demo to show how the solution is practically used in the use cases.

E2COMATION Year-end Race

19/12/2023/in Events & Public Relations, News, Project, Research & Development, Software AG/by Dirk Burkhardt

The final steps in the race to the end of the year in the E2COMATION project are underway and the major milestones have been reached. Time to take a deep breath and review the results of the project.

I started working on the E2COMATION project about 1.5 years ago and since then there have been many challenges to overcome, first and foremost a common understanding of how all the technologies paired with the know-how behind them must ultimately work together. It started with the first executable individual small demos, then extended demos, then the first live connections, and now there are finished prototypes in the project. It is always exciting to see how the work, especially in the final phases, increasingly comes together to form an overall picture and how the functional possibilities increase exponentially.

I am particularly pleased to see how much Software AG‘s technologies, especially APAMA and Trendminer, create great benefits here. This is always getting very clear when application partners use the technologies and approach you with specific feature questions. You can see that the technologies are in practical use and now it is time to turn the technology functions into production results. Which is also the outlook for the coming year in the project.

I would like to take this opportunity to wish the entire E2COMATION team a peaceful Christmas season and a happy New Year.

3rd Year E2COMATION Project Meeting in Milan

09/10/2023/in Events & Public Relations, News, Project, Research & Development, Software AG/by Dirk Burkhardt

Last week we had our 3rd year E2COMATION project meeting in Milano. The focus laid on finalizing the implementation in the four use cases. Meanwhile, the SAG’s self-analytics solution Trendminer is used in the three use-cases KEAS, MAHOU, and ROYO to have a sensorial overview of what’s happened at the production, but also to identify possible opportunities to optimize the production and to identify anomalies, which might be solved, corrected or at least send warnings automatically with the SAG’s real-time analytics solution APAMA.

As a significant milestone, Trendminer is already fully connected and configured to consume the KEAS plant data, where we already have started discussing and preparing analysis views for certain behaviors that require some optimization and cause analysis. It is impressive to see how a graphical tool like Trendminer with simplified user-friendly analytical functions could help to understand certain behaviors at the plant and in the IoT date and find potential optimization strategies together with the domain experts of the company.

E2COMATION Self-Analytics Platform with TrendMiner

03/07/2023/in Events & Public Relations, News, Project, Research & Development, Software AG/by Dirk Burkhardt

As a response to our E2COMATION project’s masterclass workshop at hub.berlin last week, I wanted to share some shown features of TrendMiner to analyze IoT data for Smart Manufacturing. As a tool that is also designed for non-data scientists, it gives a lot of analytics capabilities to production experts and engineers and simplifies the use of production data on a practical level.

For more information about TrendMiner analytics platform, please visit: https://www.trendminer.com.
For more information about the E2COMATION project, please visit: https://e2comation.eu.

Sibgha Nazir defended her Master Thesis on Visual Analytics on Enterprise Reports for Investment and Strategical Analysis

30/03/2022/in h_da, Interactive Graphics Systems Group, News, Research, VIS Research Group/by Dirk Burkhardt

In her thesis, Sibgha Nazir created a visual analytical approach to analyze annual financial reports in the perspective of investors’ interests. The goal of the thesis is to make use of visual analytics for the fundamental analysis of a business to support investors and business decision-makers. The idea is to collect the financial reports, extract the data and feed them to the visual analytics system. Financial reports are PDF documents published by public companies annually and quarterly which are readily available on companies’ websites containing the values of all financial indicators which fully and vividly paint the picture of a companies’ business. The financial indicators in those reports make the basis of fundamental analysis. The thesis focuses on those manually collected reports from the companies’ websites and conceptualizes and implements a pipeline that gathers text and facts from the reports, processes them, and feeds them to a visual analytics dashboard. Furthermore, the thesis uses state-of-the-art visualization tools and techniques to implement a visual analytics dashboard as the proof of concept and extends the visualization interface with interaction capability by giving them options to choose the parameter of their choice allowing the analyst to filter and view the available data. The dashboard fully integrates with the data transformation pipeline to consume the data that has been collected, structured, and processed and aims to display the financial indicators as well as allow the user to display them graphically. It also implements a user interface for manual data correction ensuring continuous data cleansing.

The presented application makes use of state-of-the-art financial analytics and information visualization techniques to enable visual trend analysis. The application is a great tool for investors and business analysts for gaining insights into the business and analyzing historical trends of its earnings and expenses and several other use-cases where financial reports of the business are a primary source of valuable information.

The post Sibgha Nazir defended her Master Thesis on Visual Analytics on Enterprise Reports for Investment and Strategical Analysis appeared first on Human-Computer Interaction & Visual Analyitics Reasearch Group (vis) at Darmstadt University of Applied Sciences (h_da).

Page 1 of 3123

Portfolio Items

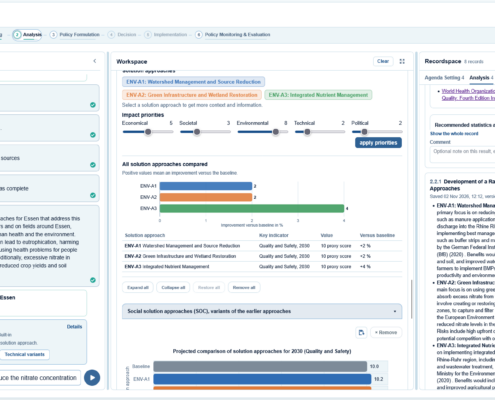
AI Policy Designer

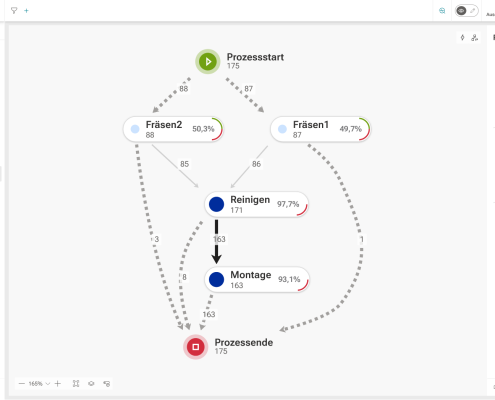
Process Mining in Manufacturing

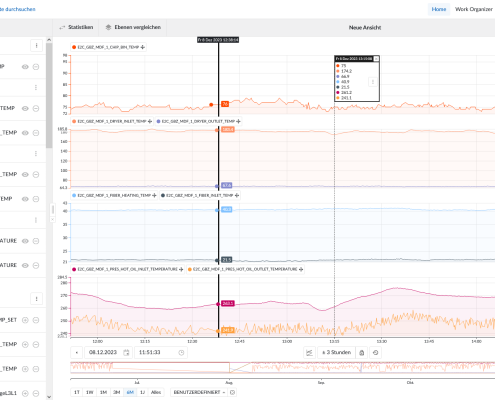
Smart Manufacturing Analysis

Scitics – Visual Trend Analytics

Search Search

Categories

  • Events (10)
  • h_da (37)
    • Computer Science (3)
    • Information Science (1)
    • Research Center (3)
    • VIS Research Group (34)
  • News (47)
  • Personal (1)
  • Research (52)
    • Project (24)
    • Publication (6)
  • Software AG (34)
    • Events & Public Relations (13)
    • Research & Development (31)
  • Teaching (11)
  • TU Darmstadt (8)
    • Computer Science (5)
    • Interactive Graphics Systems Group (8)

Archives

Tags

AAS Analysis Big data Analytics Business Analytics CERC Circular Economy CliCE-DiPP CO2 CO2footprint Conference Data Analysis Data Visualization Digital Product Passwort E2COMATION Emission Reduction Emissions Energy Energy Efficiency Energy Optimization Energy Saving EU Europe European Event Human-Computer Interaction h_da Innovation Management LCA Product Carbon Footprint Project Research Research Project Seminar Smart Manufacturing Software AG Software AG Reasearch Sustainability Sustainability Assessment Sustainable Manufacturing Teaching Trend Analysis TrendMiner TU Darmstadt Visual Analytics Visual Trend Analytics

Recent Posts

  • Presenting CliCE-DiPP Results at the iV 202515/08/2025 - 10:48
  • Two Paper Accepted at iV 2025 Conference16/06/2025 - 16:24
  • CliCE-DiPP Consortium Meeting in Gaggenau04/06/2025 - 17:12
  • Final Project Review in E2COMATION03/04/2025 - 13:00

h_da Contact

Dipl.-Inf. Dirk Burkhardt
Darmstadt University of Applied Sciences
Department of Computer Science
Schöfferstraße 3
D-64295 Darmstadt

Visitor address:
Schöfferstraße 8
D-64295 Darmstadt
Building D19 / Office 2.13


Stay Tuned

Mind the following RSS feeds:

Personal News

Personal Publications

Links

  • Research @Software AG
  • Policy Modelling Community
  • Dozenturio – Digitale Bildung & Digitales Lernen Groß-Gerau
  • Research Group on Human-Computer Interaction & Visual Analytics @h_da
©2026 by Dirk Burkhardt
  • Link to Orcid
  • Link to Researchgate
  • Link to Google scholar
  • Link to Dblp
  • Link to LinkedIn
  • Link to Xing
  • Link to Bluesky
  • Contact/Imprint
  • Privacy
Scroll to top Scroll to top Scroll to top

This site uses cookies. By continuing to browse the site, you are agreeing to our use of cookies.

OKLearn more

Cookie and Privacy Settings


How we use cookies

We may request cookies to be set on your device. We use cookies to let us know when you visit our websites, how you interact with us, to enrich your user experience, and to customize your relationship with our website.

Click on the different category headings to find out more. You can also change some of your preferences. Note that blocking some types of cookies may impact your experience on our websites and the services we are able to offer.

Essential Website Cookies

These cookies are strictly necessary to provide you with services available through our website and to use some of its features.

Because these cookies are strictly necessary to deliver the website, refusing them will have impact how our site functions. You always can block or delete cookies by changing your browser settings and force blocking all cookies on this website. But this will always prompt you to accept/refuse cookies when revisiting our site.

We fully respect if you want to refuse cookies but to avoid asking you again and again kindly allow us to store a cookie for that. You are free to opt out any time or opt in for other cookies to get a better experience. If you refuse cookies we will remove all set cookies in our domain.

We provide you with a list of stored cookies on your computer in our domain so you can check what we stored. Due to security reasons we are not able to show or modify cookies from other domains. You can check these in your browser security settings.

Other external services

We also use different external services like Google Webfonts, Google Maps, and external Video providers. Since these providers may collect personal data like your IP address we allow you to block them here. Please be aware that this might heavily reduce the functionality and appearance of our site. Changes will take effect once you reload the page.

Google Webfont Settings:

Google Map Settings:

Google reCaptcha Settings:

Vimeo and Youtube video embeds:

Privacy Policy

You can read about our cookies and privacy settings in detail on our Privacy Policy Page.

Privacy Policy
Accept settingsHide notification only